近日接到一客户的电话,业务人员反馈无法建立新的连接请求,而已有的会话却无法对数据进行操作,初步判断很可能是数据库存在资源等待或是hung住,后前往客户现场,查看alert.log及相关信息,确定为数据库hung死,其alert.log中频繁出现PMON获取latch失败:
Wed Oct 16 22:00:12 2013
Thread 1 advanced to log sequence 25413 (LGWR switch)
  Current log# 5 seq# 25413 mem# 0: /ora_data/orcl/redo05.log
Wed Oct 16 22:07:15 2013
WARNING: inbound connection timed out (ORA-3136)
Wed Oct 16 22:08:18 2013
WARNING: inbound connection timed out (ORA-3136)
Wed Oct 16 22:08:33 2013
kkjcre1p: unable to spawn jobq slave process
Wed Oct 16 22:08:33 2013
Errors in file /oracle/admin/orcl/bdump/orcl_cjq0_512234.trc:
Wed Oct 16 22:09:33 2013
PMON failed to acquire latch, see PMON dump
Wed Oct 16 22:10:33 2013
PMON failed to acquire latch, see PMON dump
Wed Oct 16 22:10:54 2013
kkjcre1p: unable to spawn jobq slave process
Wed Oct 16 22:10:54 2013
Errors in file /oracle/admin/orcl/bdump/orcl_cjq0_512234.trc:
Wed Oct 16 22:11:33 2013
PMON failed to acquire latch, see PMON dump
Wed Oct 16 22:12:33 2013
PMON failed to acquire latch, see PMON dump
Wed Oct 16 22:13:33 2013
PMON failed to acquire latch, see PMON dump
Wed Oct 16 22:14:33 2013
PMON failed to acquire latch, see PMON dump
Wed Oct 16 22:15:33 2013
PMON failed to acquire latch, see PMON dump
Wed Oct 16 22:16:34 2013
PMON failed to acquire latch, see PMON dump
Wed Oct 16 22:17:34 2013
PMON failed to acquire latch, see PMON dump
Wed Oct 16 22:18:34 2013
PMON failed to acquire latch, see PMON dump
Wed Oct 16 22:19:34 2013
PMON failed to acquire latch, see PMON dump
Wed Oct 16 22:20:34 2013
PMON failed to acquire latch, see PMON dump
Wed Oct 16 22:21:34 2013
PMON failed to acquire latch, see PMON dump
Wed Oct 16 22:22:34 2013
PMON failed to acquire latch, see PMON dump
Wed Oct 16 22:23:34 2013
PMON failed to acquire latch, see PMON dump
Wed Oct 16 22:24:34 2013
PMON failed to acquire latch, see PMON dump
Wed Oct 16 22:25:34 2013
PMON failed to acquire latch, see PMON dump
Wed Oct 16 22:26:34 2013
PMON failed to acquire latch, see PMON dump
Wed Oct 16 22:27:34 2013
PMON failed to acquire latch, see PMON dump
Wed Oct 16 22:28:34 2013
PMON failed to acquire latch, see PMON dump
Wed Oct 16 22:29:34 2013
PMON failed to acquire latch, see PMON dump
Wed Oct 16 22:30:35 2013
PMON failed to acquire latch, see PMON dump
Wed Oct 16 22:31:35 2013
PMON failed to acquire latch, see PMON dump
Wed Oct 16 22:32:35 2013
PMON failed to acquire latch, see PMON dump
Wed Oct 16 22:33:35 2013
PMON failed to acquire latch, see PMON dump
Wed Oct 16 22:34:35 2013
PMON failed to acquire latch, see PMON dump
Wed Oct 16 22:35:35 2013
PMON failed to acquire latch, see PMON dump
Wed Oct 16 22:36:35 2013
PMON failed to acquire latch, see PMON dump
Wed Oct 16 22:37:35 2013
PMON failed to acquire latch, see PMON dump
Wed Oct 16 22:38:35 2013
PMON failed to acquire latch, see PMON dump
Wed Oct 16 22:39:35 2013
PMON failed to acquire latch, see PMON dump
...........................................
为了确定具体原因,使用sqlplus以sysdba登录数据库hung住,则无法查数据库资源使用及等待情况,使用ps -ef|grep local=no存在大量的应用进程,kill掉之后数据库依然hung住,为了在最短时间内恢复应用,最后客户选择了重启主机来完成数据库重启(其实在重启主机之前应该做一个Hanganalyze and Systemstate Dumps或是RDA,以便事后确定数据库hung死的根本原因)。
事后尝试进行了一些详细分析,但是最终还是不能非常确定此CASE的根本原因,以下为分析过程:
1)alert.log中出现PMON failed to acquire latch前,曾出现了一个kkjcre1p: unable to spawn jobq slave process错误,对应的trace文件orcl_cjq0_512234.trc内容如下:
*** 2013-10-16 22:07:19.030
Waited for process J002 to initialize for 60 seconds
*** 2013-10-16 22:07:19.199
Dumping diagnostic information for J002:
OS pid = 5587050
loadavg : 5.31 5.76 5.78
swap info: free_mem = 77.07M rsv = 72.00M
           alloc = 6257.89M avail = 18432.00M swap_free = 12174.11M
       F S      UID     PID    PPID   C PRI NI ADDR    SZ    WCHAN    STIME    TTY  TIME CMD
  240001 A   oracle 5587050       1   0  60 20 e858f590 92492          22:06:18      -  0:00 ora_j002_orcl
open: The file access permissions do not allow the specified action.
Warning: executed in non-root mode
procstack cannot verify that /unix matches the running kernel.
Kernel symbols might not be validated.
5587050: ora_j002_orcl
0x00000001000fc898  sskgpwwait(??, ??, ??, ??, ??) + 0x38
0x00000001000f9e7c  skgpwwait(??, ??, ??, ??, ??) + 0xbc
0x000000010011dbac  kslges(??, ??, ??, ??, ??) + 0x54c
0x00000001001219dc  kslgetl(??, ??, ??, ??) + 0x33c
0x00000001049f0978  ksfglt(??, ??, ??, ??, ??) + 0x198
0x00000001000847b4  kghfrunp(??, ??, ??, ??, ??, ??, ??) + 0x794
0x000000010007a488  kghfnd(??, ??, ??, ??, ??, ??) + 0x7e8
0x0000000100098444  kghalo(??, ??, ??, ??, ??, ??, ??, ??) + 0xa24
0x0000000100005908  ksp_param_handle_alloc(??) + 0x168
0x000000010001d21c  kspcrec(??) + 0x1bc
0x00000001001407e8  ksucre(??) + 0x408
0x0000000103081ab0  kkjrdp() + 0x350
0x000000010430c190  opirip(??, ??, ??) + 0x4f0
0x0000000102d9a598  opidrv(??, ??, ??) + 0x458
0x000000010370b0b0  sou2o(??, ??, ??, ??) + 0x90
0x0000000100000870  opimai_real(??, ??) + 0x150
0x00000001000006d8  main(??, ??) + 0x98
0x0000000100000368  __start() + 0x98
*** 2013-10-16 22:07:25.067
*** 2013-10-16 22:07:35.068
Waited for process J002 to initialize for 70 seconds
*** 2013-10-16 22:07:35.068
Dumping diagnostic information for J002:
OS pid = 5587050
loadavg : 5.75 5.83 5.81
swap info: free_mem = 72.61M rsv = 72.00M
           alloc = 6257.04M avail = 18432.00M swap_free = 12174.96M
       F S      UID     PID    PPID   C PRI NI ADDR    SZ    WCHAN    STIME    TTY  TIME CMD
  240001 A   oracle 5587050       1   0  60 20 e858f590 92492          22:06:18      -  0:00 ora_j002_orcl
open: The file access permissions do not allow the specified action.
Warning: executed in non-root mode
procstack cannot verify that /unix matches the running kernel.
Kernel symbols might not be validated.
5587050: ora_j002_orcl
0x00000001000fc898  sskgpwwait(??, ??, ??, ??, ??) + 0x38
0x00000001000f9e7c  skgpwwait(??, ??, ??, ??, ??) + 0xbc
0x000000010011dbac  kslges(??, ??, ??, ??, ??) + 0x54c
0x00000001001219dc  kslgetl(??, ??, ??, ??) + 0x33c
0x00000001049f0978  ksfglt(??, ??, ??, ??, ??) + 0x198
0x00000001000847b4  kghfrunp(??, ??, ??, ??, ??, ??, ??) + 0x794
0x000000010007a488  kghfnd(??, ??, ??, ??, ??, ??) + 0x7e8
0x0000000100098444  kghalo(??, ??, ??, ??, ??, ??, ??, ??) + 0xa24
0x0000000100005908  ksp_param_handle_alloc(??) + 0x168
0x000000010001d21c  kspcrec(??) + 0x1bc
0x00000001001407e8  ksucre(??) + 0x408
0x0000000103081ab0  kkjrdp() + 0x350
0x000000010430c190  opirip(??, ??, ??) + 0x4f0
0x0000000102d9a598  opidrv(??, ??, ??) + 0x458
0x000000010370b0b0  sou2o(??, ??, ??, ??) + 0x90
0x0000000100000870  opimai_real(??, ??) + 0x150
0x00000001000006d8  main(??, ??) + 0x98
0x0000000100000368  __start() + 0x98
从orcl_pmon_508278.trc文件中看出,job进程启动失败,发现该进程已经dead:
*** 2013-10-17 13:50:01.856
found process 7000001938ff898 pid=185 serial=235 ospid = 5587050 dead
2)alert.log中PMON failed to acquire latch产生的PMON trace文件orcl_pmon_508278.trc内容如下:
*** 2013-10-16 22:09:33.682
PMON unable to acquire latch  7000000100e9bb0 Child shared pool level=7 child#=2
       Location from where latch is held: kghfrunp: alloc: session dur:
       Context saved from call: 0
       state=busy, wlstate=free
   waiters [orapid (seconds since: put on list, posted, alive check)]:
    225 (111, 1381932633, 3)
    231 (111, 1381932633, 0)
    232 (105, 1381932633, 3)
    190 (105, 1381932633, 3)
    258 (3, 1381932633, 3)
    259 (3, 1381932633, 3)
    260 (3, 1381932633, 0)
    261 (3, 1381932633, 0)
    262 (3, 1381932633, 0)
    waiter count=44
   gotten 471786337 times wait, failed first 1679732 sleeps 3225437
   gotten 0 times nowait, failed: 0
 possible holder pid = 227 ospid=5193976
----------------------------------------
SO: 700000193909df8, type: 2, owner: 0, flag: INIT/-/-/0x00
 (process) Oracle pid=227, calls cur/top: 0/700000181230280, flag: (0) -
           int error: 0, call error: 0, sess error: 0, txn error 0
 (post info) last post received: 0 0 0
             last post received-location: No post
             last process to post me: none
             last post sent: 0 0 0
             last post sent-location: No post
             last process posted by me: none
 (latch info) wait_event=0 bits=a0
   holding    (efd=6) 7000000100e9bb0 Child shared pool level=7 child#=2
       Location from where latch is held: kghfrunp: alloc: session dur:
       Context saved from call: 0
       state=busy, wlstate=free
       waiters [orapid (seconds since: put on list, posted, alive check)]:
        225 (652, 1381933174, 3)
        232 (646, 1381933174, 3)
        190 (646, 1381933174, 3)
        236 (634, 1381933174, 3)
        363 (240, 1381933174, 3)
        364 (234, 1381933174, 3)
        394 (153, 1381933174, 3)
        waiter count=146
   holding    (efd=6) 700000189fe4098 Child library cache level=5 child#=2
       Location from where latch is held: kghfrunp: clatch: wait:
       Context saved from call: 0
       state=busy, wlstate=free
       waiters [orapid (seconds since: put on list, posted, alive check)]:
        199 (652, 1381933174, 3)
        38 (652, 1381933174, 3)
        220 (652, 1381933174, 3)
        211 (652, 1381933174, 3)
        207 (652, 1381933174, 3)
        226 (652, 1381933174, 3)
        196 (652, 1381933174, 3)
        223 (652, 1381933174, 3)
        215 (652, 1381933174, 3)
        144 (652, 1381933174, 3)
        221 (652, 1381933174, 3)
        76 (634, 1381933174, 3)
        35 (529, 1381933174, 3)
        106 (514, 1381933174, 3)
        135 (463, 1381933174, 3)
        104 (408, 1381933174, 3)
        105 (393, 1381933174, 3)
        133 (288, 1381933174, 3)
        162 (168, 1381933174, 3)
        waiter count=19
   Process Group: DEFAULT, pseudo proc: 700000193a46758
   O/S info: user: oracle, term: UNKNOWN, ospid: 5193976
   OSD pid info: Unix process pid: 5193976, image: oracle@gxjh_db
   Short stack dump:
ksdxfstk+002c<-ksdxcb+04e4<-sspuser+0074<-000044C0<-skgpwwait+00bc<-ksliwat+06c0<-kslwaitns_timed+0024<-kskthbwt+022c<-kslwait+00f4<-kksLockWait+01fc<-kgxWait+0168<-kgxExclusive+00bc<-kksFreeHeapGetMutex+0158<-kksCursorFreeCallBack+0088<-kglobf0+0264<-kglhpd_internal+0228<-kglhpd+0010<-kghfrx+0028<-kghfrunp+0b44<-kghfnd+07e8<-kghalo+0a24<-ksp_param_handle_alloc+0100<-kspcrec+01bc<-ksucre+0408<-ksucresg+017c<-kpolna+02c4<-kpolon+02e0<-opiodr+0ae0<-ttcpip+1020<-opitsk+1124<-opiino+0990<-opiodr+0ae0<-opidrv+0484<-sou2o+0090<-opimai_real+01bc<-main+0098<-__start+0098
Dump of memory from 0x0700000193881630 to 0x0700000193881838
700000193881630 00000004 00000000 07000001 81169F18  [................]
700000193881640 00000010 000313A7 07000001 81230280  [.............#..]
700000193881650 00000003 000313A7 07000001 8E11F350  [...............P]
700000193881660 0000000B 000313A7 07000001 90E23DF0  [..............=.]
700000193881670 00000004 0003129B 00000000 00000000  [................]
700000193881680 00000000 00000000 00000000 00000000  [................]
       Repeat 26 times
700000193881830 00000000 00000000                    [........]
*** 2013-10-16 22:28:34.878
PMON unable to acquire latch  700000010007608 session allocation level=5
       Location from where latch is held: ksucrp:
       Context saved from call: 0
       state=busy, wlstate=free
   waiters [orapid (seconds since: put on list, posted, alive check)]:
    21 (834, 1381933774, 0)
    26 (834, 1381933774, 0)
    175 (258, 1381933774, 3)
    151 (258, 1381933774, 3)
    9 (183, 1381933774, 0)
    205 (18, 1381933774, 3)
    waiter count=151
   gotten 2384768601 times wait, failed first 1244465 sleeps 32489
   gotten 0 times nowait, failed: 0
   recovery area:
Dump of memory from 0x0700000010007978 to 0x0700000010007978
 possible holder pid = 364 ospid=3707158
----------------------------------------
SO: 700000190920928, type: 2, owner: 0, flag: INIT/-/-/0x00
 (process) Oracle pid=364, calls cur/top: 0/0, flag: (0) -
           int error: 0, call error: 0, sess error: 0, txn error 0
 (post info) last post received: 0 0 0
             last post received-location: No post
             last process to post me: none
             last post sent: 0 0 0
             last post sent-location: No post
             last process posted by me: none
 (latch info) wait_event=0 bits=20
       Location from where call was made: kghalo:
   waiting for 7000000100e9bb0 Child shared pool level=7 child#=2
       Location from where latch is held: kghfrunp: alloc: session dur:
       Context saved from call: 0
       state=busy, wlstate=free
       waiters [orapid (seconds since: put on list, posted, alive check)]:
        225 (1252, 1381933774, 0)
        232 (1246, 1381933774, 0)
        363 (840, 1381933774, 0)
        364 (834, 1381933774, 0)
        394 (753, 1381933774, 0)
        waiter count=146
       gotten 471786337 times wait, failed first 1679732 sleeps 3225437
       gotten 0 times nowait, failed: 0
       possible holder pid = 227 ospid=5193976
   on wait list for 7000000100e9bb0
   holding    (efd=3) 700000010007608 session allocation level=5
       Location from where latch is held: ksucrp:
       Context saved from call: 0
       state=busy, wlstate=free
       waiters [orapid (seconds since: put on list, posted, alive check)]:
        21 (834, 1381933774, 0)
        26 (834, 1381933774, 0)
        43 (834, 1381933774, 0)
        178 (834, 1381933774, 0)
        41 (834, 1381933774, 0)
        181 (834, 1381933774, 0)
        151 (258, 1381933774, 3)
        9 (183, 1381933774, 0)
        205 (18, 1381933774, 3)
        waiter count=151
   O/S info: user: oracle, term: UNKNOWN, ospid: 3707158
   OSD pid info: Unix process pid: 3707158, image: oracle@gxjh_db
   Short stack dump:
ksdxfstk+002c<-ksdxcb+04e4<-sspuser+0074<-000044C0<-skgpwwait+00bc<-kslges+054c<-kslgetl+033c<-ksfglt+0198<-kghalo+06c8<-ksmdacnk+0154<-ksmdget+0248<-kssadpm+02e4<-ksucrp+04e8<-opiino+03d4<-opiodr+0ae0<-opidrv+0484<-sou2o+0090<-opimai_real+01bc<-main+0098<-__start+0098
Dump of memory from 0x070000019087EE28 to 0x070000019087F030
70000019087EE20                   00000001 00000000          [........]
70000019087EE30 07000000 A9BB4038 00000010 000313A7  [......@8........]
70000019087EE40 00000000 00000000 00000000 00000000  [................]
 Repeat 30 times
从该PMON trace文件中可以发现,在2013-10-16 22:09:33,PMON获取latch 7000000100e9bb0失败,这个latch的持有者为pid=227,2013-10-16 22:28:34,PMON获取latch 700000010007608失败,这个latch的持有者为 pid=364,而这个进程在等待latch 7000000100e9bb0
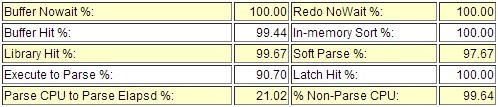
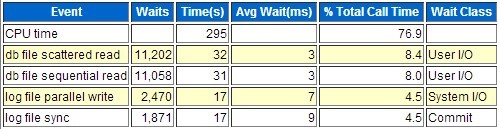
3)收集数据库PMON failed to acquire latch前最近的AWR及OS日志无异常。
到此,该分析工作基本也只能进行到此,从PMON的trace分析,这个问题是由于share pool争用引起的,这一点从trace文件中下面的部分可以看出:
但是,因为没有system state dump,我们缺少足够的证据分析根本原因,基于经验,最可能的原因有如下几种:
*** 2013-10-16 22:09:33.682
PMON unable to acquire latch 7000000100e9bb0 Child shared pool level=7 child#=2
Location from where latch is held: kghfrunp: alloc: session dur:
1.share pool不足;
2.oracle bug,比如bug 7039896与该CASE非常相似;
3.其它偶然的事件造成进程之间阻塞;
Recommended solution:
1.可以适当增加share pool的大小,还可以按bug 7039896中给出的workaround尝试一下;
2.数据库版本为10.2.0.4,这个版本上有很多bug都可以造成类似的问题,建议升致10.2.0.5以上的版本;
3.如果问题重现,需先做system state dump和Hanganalyze,以便确定其根本原因。